Problem and Objective
As a consulting GIS analyst, I have been hired by North Carolina’s Office of State Human Resources to develop a series of thematic maps and visualize possible spatial patterns in Census data for Wake County. In collaboration with my partner Ian Grace, we have been tasked with identifying spatial patterns in Census data concerning “age by language spoken at home by ability to speak English for the population 5 years and over.” As Wake County’s Latinx population continues to grow, State Human Resources has asked that we locate areas within Wake County that speak Spanish only.
Analysis Procedure
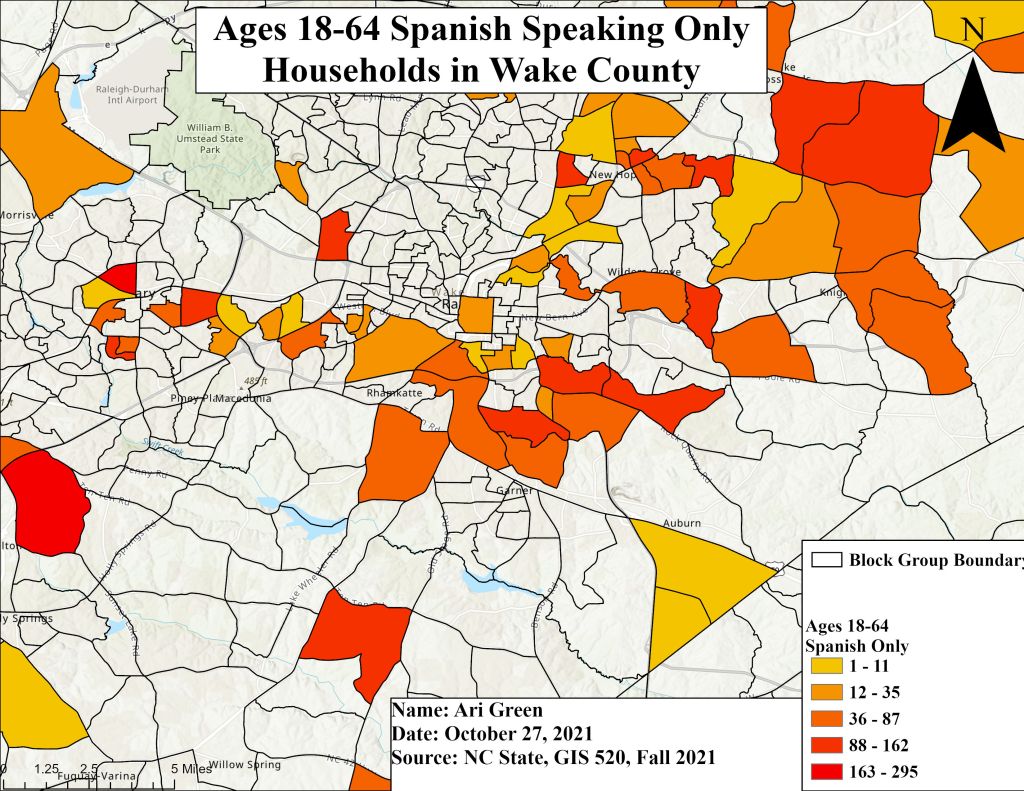
To identify concentrations of Spanish-speaking areas in Wake County, I used ArcGIS Pro and two different spatial pattern analysis tools. The primary input data used for this assignment came in form of Census data, specifically tabular/spreadsheet data on the Age by Language Spoken at Home by Ability to Speak English (B166004) and the 2019 Wake County Block Group TIGER file. Census data can be analyzed by using spatial pattern analysis tools to explain if the data is clustering and why it is clustering. First, I used the Excel to Table tool to insert the Age by Language Spoken At Home .xls file into ArcPro, I named this table “Census Table”. Once I confirmed that the data imported correctly and without null values, I used the “Add Field” tool to insert a new field in the attribute table to create a refined GEOID. Then I added the 2019 North Carolina Block Groups to the map and used the “Select by Attribute” tool to identify Wake County Block Groups, which I identified by attribute field “COUNTYFP” which is 183 for Wake County. I used the “Export Feature” to isolate Wake County Block Group Boundary as its own layer. I reviewed the attribute table of the Wake County BG Boundary to confirm that only Wake County Block Groups were in this layer, then I used the tool “Join” to join the tabular data to the spatial data by both layers’ “GEOID” fields. Once the join was successful, I used “graduated colors” to symbolize the census data to visualize a thematic map.
For Part 2, I performed a local pattern analysis by using the Hot Spot Analysis Tool. My input feature class was the Census Table, my input field was the attribute field “B16004_030E,” which is the “Age by Language Spoken At Home” that Ian and I decided to evaluate. I used a Fixed Distance Band of 5280.
Results
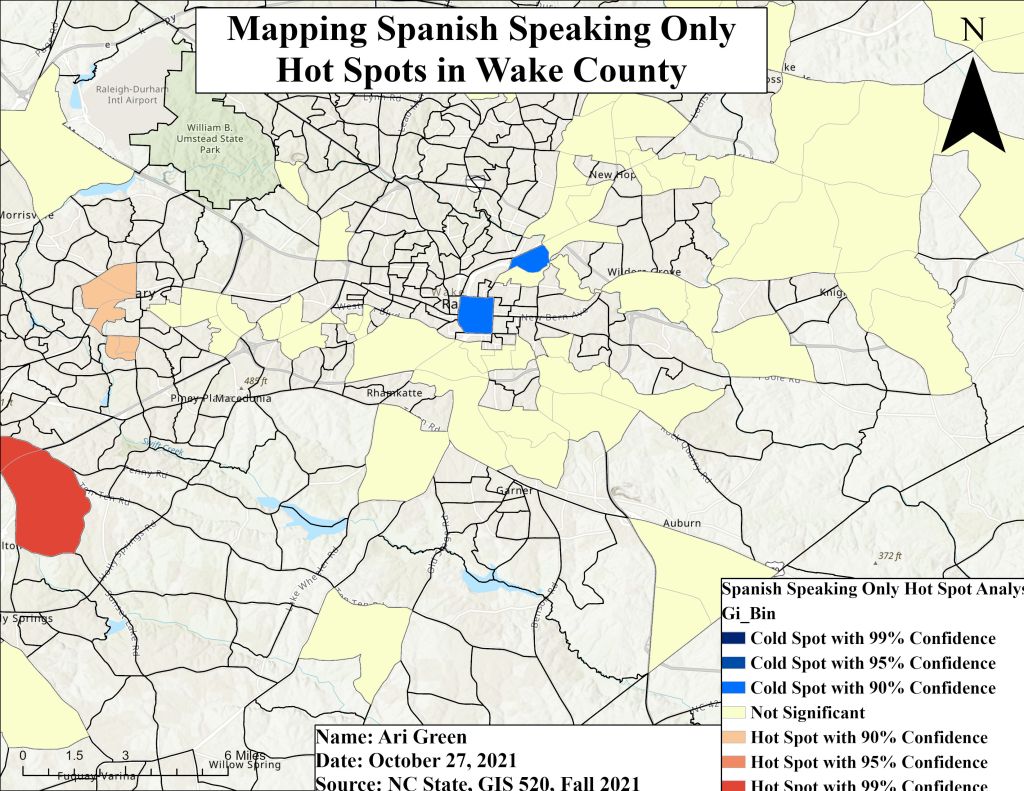
Application and Reflection
In completing assignment 7, I understood immediately why this assignment was given two weeks to complete. My initial meeting with my partner was sort of awkward because they had not fully grasped the concept of searching for and downloading specific data sets and TIGER files from the Census Bureau. As we worked together to agree on a dataset and decided on what methods we would both use, I determined that this using Census data with respect to population and median income can be used to help cities build/develop new infrastructure such as houses or apartment complexes. For example, once a city knows how much their population as increased overall, they can use spatial pattern analysis tools to determine which areas [of a city] saw the greatest increase in population and determine where housing is needed. This can also be applied to analyzing where to build trauma hospitals.
Problem Description: The City of Sacramento recognizes that its population continues to grow exponentially and at a fast rate. They have asked GIS analysts to work with newly released 2020 Census data to determine where housing is mostly needed throughout Sacramento.
Data Needed: 2020 Census demographics data, City of Sacramento Boundary, Streets, Median Income tabular data, vacancy rates, schools, police stations, fire stations, median rental price
Analysis Procedures: First a spatial join between the City of Sacramento boundary and demographic tabular data should be performed to display Sacramento’s current population. Then a Hot Spot Analysis should be performed to locate concentrated clusters of population.
