Problem and Objective
Dallas County has hired me, a GIS analyst, to perform a cluster and outlier analysis to determine if there are any relationships between incidents and the median household income in a specific census block group. The goal is to locate hot and cold spots of the census data.
Analysis Procedure
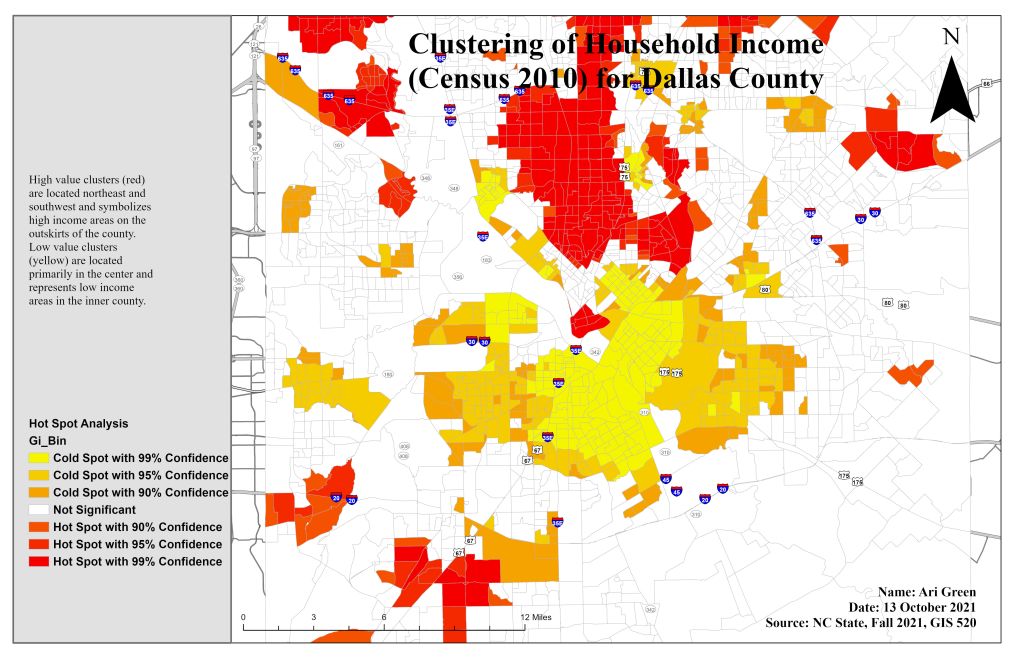
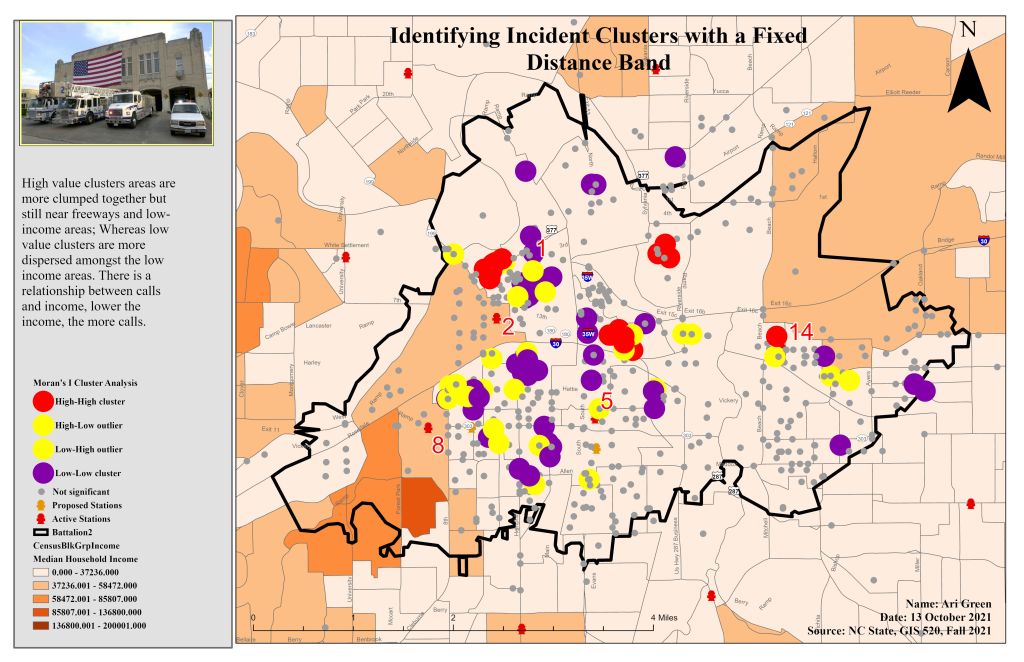
To further demonstrate mastery in using statistical tools, I used ArcGIS Pro and two different analysis tools – local and global. The primary input data used for this assignment came in form of maps that were already developed to complete the tutorials (to teach) and exercises (to use as fresh data on my own), both were centered around service/incident calls data. This data included census data, Dallas County boundary, and City of Ft. Worth data. Geographic data can be analyzed by describing and displaying the relationship between other data. Spatial statistics allows me to measure the intensity of the clustering as well as identifying values that are the same – together. First, I used the Cluster and Outlier Analysis tool to create a feature class that would display the level of clustering and determine the type of clustering (high and low values and outliers). To minimize the number of outliers and errors, I ran the Cluster and Outlier Analysis tool again with a distance band of 900 feet. Secondly, I performed a hot spot analysis by using the Getis-Ord Gi tool to identify the clusters of residents who have a high-income versus low-income and in what areas these clusters are in.
Results
Application and Reflection
After using the tools Cluster and Outlier Analysis and Getis-Ord Gi tools, I learned that these tools are essential to identifying concentrations of high values, low values, spatial outliers, and calculating the statistic for each feature in dataset. The ability to identify the intensity in the clustering is useful when it comes to working with car accident data. With the car accident data, cities, car insurances, car companies can identify where and why most accidents happen in certain areas.
Problem Description: Progressive Car Insurance is making updates to their premium rates for new customers in the City of Raleigh. They have asked for a gis analyst to identify concentrations of car accidents by zipcode, so that they can give new customers accurate rates based on the area they live in. A cluster and outlier analysis and Getis-Ord Gi analysis will be performed to locate concentrations of spatial outliers and high values in car accidents in the City of Raleigh.
Data Needed: City of Raleigh Boundary, Raleigh Streets, Number of Accidents (tabular data).
Analysis Procedures: Spatially illustrate where the number of accidents (plot accidents data onto a map) to locate the concentration of accidents by performing a cluster and outlier analysis. Then conduct a Getis-Ord Gi analysis to determine the intensity of the clustering in accidents. These analyses will assist Progressive Car Insurance Company to determine premium rates to give to customers who both live in areas with high accident rates and do not live near areas where a lot of accidents occur.
