Problem and Objective
North Carolina surveyed its residents to determine the number of industrial jobs created in each House District and Senate District throughout the state. Senators and Congressmen are interested in seeing how many jobs were created in their respective district. Therefore, the objective of this assignment is to identify the total number of jobs created in each Senate District and House District.
Analysis Procedures
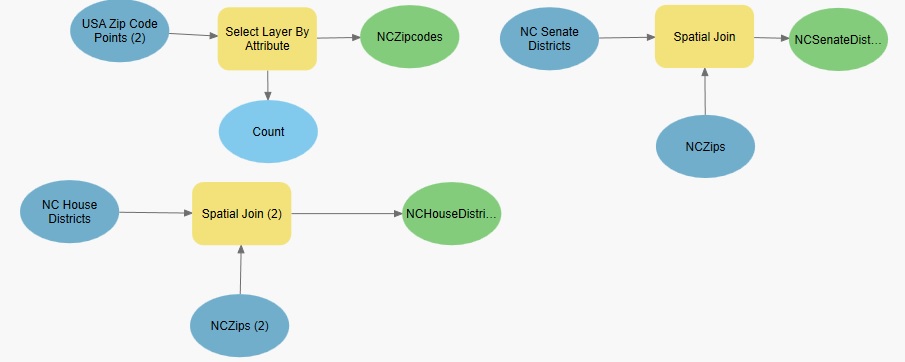
To address identify the number of jobs for each district, I used ArcGIS Pro and the summarize tool, join tool, and spatial join tool. The primary input data utilized for this assignment came in the form of employment data in Microsoft Excel spreadsheet (.csv), which Dr. Parvan provided. I downloaded a Zipcode Layer Package from ArcGIS Online. And finally, I downloaded the 2018 House Districts and Senate Districts shapefiles to use as reference data. Survey data can be visualized through data cardinality by establishing associations between a layer (spatial) and a table (additional attributes). Creating relationships allows me to symbolize/label features based on attributes from a joined table. For this project, I first used the Select by Attribute tool for both the Zipcode layer and the tabular data from the Survey Results, which allowed me to export only North Carolina results to focus on and named them NCZipcodes.shp and NCJobs.shp. Secondly, I used the summarize tool on the “EMPLOY_SUM” attribute field to create a new table to tally the total number of jobs alone – NumJobs table. Using the NCZipcodes layer, I did a tabular join with the table, which then attaches the number of jobs to spatial data to be displayed on the map. I completed a spatial join between this new layer and the Senate Districts and the House Districts. Lastly, because labeling is automatically set to list the names of cities, I used the Label Properties tool to create a query that allowed me to symbolize the number of jobs in each district.
Workflow Diagram:
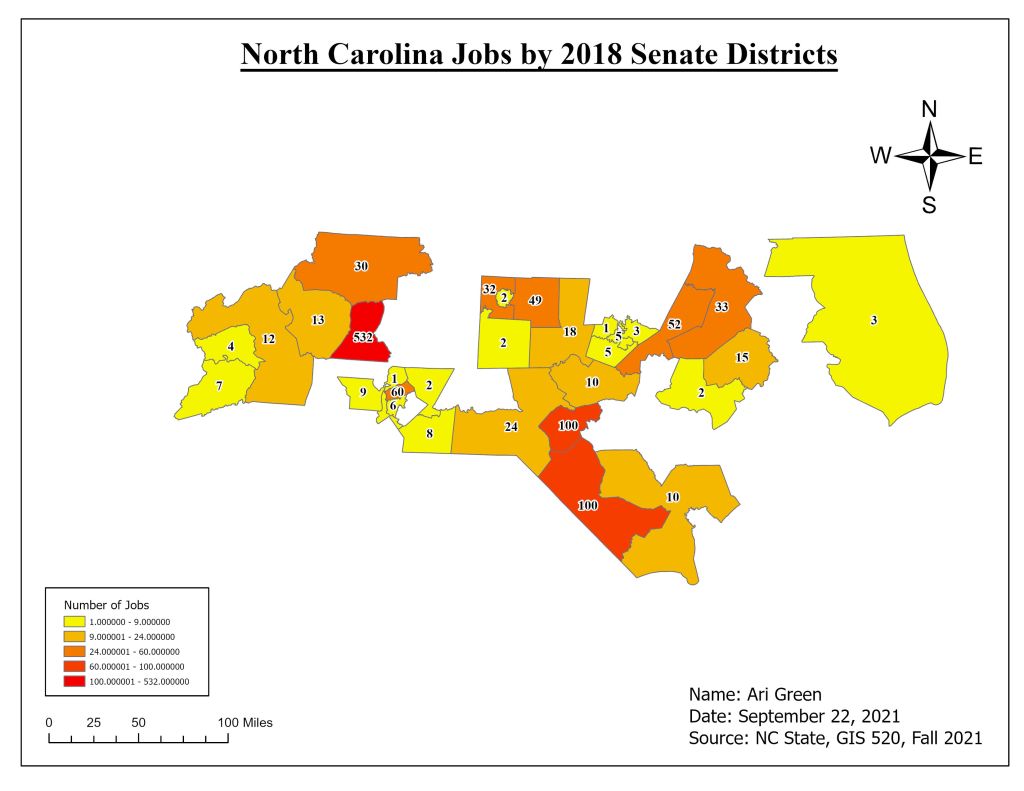
Results

Application and Reflection
Establishing associations and initiating joins is an important analysis tool when working with ArcGIS Pro (or ArcMap) because data is often stored in the form of .csv files and will not have any reference data. Also, the data stored in these .csv files will have different values for each attribute (i.e.: string data, text data, or double). An example of data that is consistently stored in .csv files is Census Data or demographic data. Demographic data is equally if not more important to cities, Senate districts, and House Districts across the nation and is utilized to count population, redistricting, distribute government funds, age breakdown, median income, and countless other reasons. One problem that can addressed by using a spatial join would be a City Councilman wanting a demographic breakdown of their constituents so that they are aware of who they are serving. For example, Councilmen Branch of Raleigh City Council would ask his staff to provide a demographic breakdown of District C (which is primarily Southeast Raleigh) and this would require city GIS analysts to obtain a City of Raleigh boundary shapefile, City of Raleigh Districts shapefile, and the latest Census data in tabular form (.csv).
Problem Description: The City of Raleigh has asked its Redistricting Commission to redraw the district boundaries based on the count of population from the 2020 Decennial Census.
Data Needed: City of Raleigh Boundary, City of Raleigh Districts, 2020 Census Demographic Data (tabular data), Designated Raleigh Communities, Zipcodes, Raleigh City Charter
Analysis Procedure: To redraw the city council districts, the Redistricting Commission must determine how much the City of Raleigh has grown since the last Census complete count (2010) and determine the target population for each district that is fair and equal in size. Then adjust the boundaries, based on target population and the criteria set forth in the Charter.
