Problem and Objective
A San Diego Wine Company has hired a GIS analyst to find the best location for developing a vineyard but they are concerned about temperatures. The GIS analyst must perform a weighted suitability analysis to determine the best place for a vineyard and tasting room by considering multiple criteria.
Analysis Procedures
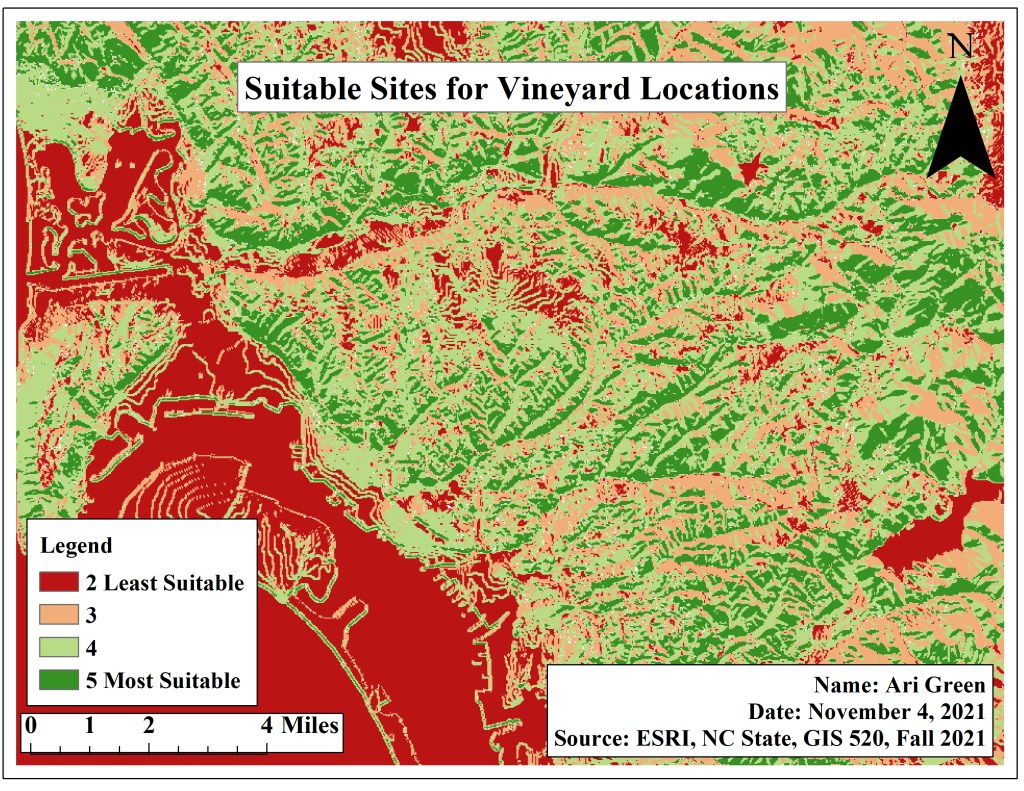
The data primarily used for this assignment was an elevation raster image and a vineyard geodatabase with a freeways shapefile provided by ESRI. ArcMap has the ability to conduct a weighted suitability analysis with the spatial analyst extension. The first step is to run the Aspect tool on the elevation raster image. Then run the Slope tool to calculate the slope of the elevation raster image. Next, I used the Euclidean Distance tool to calculate distance. The wine company would like for freeways to be within a one-mile radius of the vineyard. Next, I ran the reclassify for tool for the layers, aspect and freeways, so that each layer has the same values. After reclassifying the data, I finally ran the weighted overlay tool with the layers: slope, aspect, distance to freeways, and set the weights to 50% for aspect, 30% for slope, and 20% for distance to freeways.
Results
Application and Reflection
In completing assignment 9, I understand why site selection/suitability analysis including a weighted overlay are necessary and its use. The Esri course was very clear on why institutions and companies might use suitability analysis. Suitability analysis can be used by the U.S. Military when determining potential and the best place to build new military bases.
Problem Description: The United States Military has decided to expand its military and construct new bases within the United States. They have asked military gis analysts to conduct a suitability analysis to locate two cities that will allow for new bases. One base has to be a in coastal city and one base has to be inland.
Data Needed: Demographics of the United States, oceans, tiger files of United States, data on traffic congestion, flood and storm mitigation data, federal land availability
Analysis Procedures: First the analyst would need to spatially display what and how much federal land is available, so geocoding locations within the United States that are vacant. Criteria regarding how big (square footage) the bases are to be, and apply that criterion to federal land available to eliminate small land masses.
